We all know that Wikipedia offers a huge list of information, which is quite helpful during topic and keyword research. The three most factors that contribute to this fact are user-generated, well-moderated and heavily interlinked.
According to one of the recent blog post at SEJ following are some of the Wikipedia visualization tools that can help in researching relevant keywords and topics.
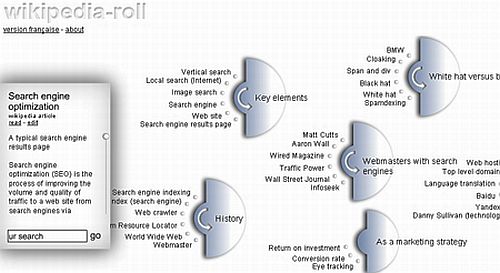
- Wikipedia-roll – It scans through different Wikipedia articles by concepts and items. For example, if you type in “Search Engine Optimization†in this tool you’ll get:
- Key elements;
- Histories;
- Webmasters with search engines;
- As a marketing strategy;
- White hat versus black hat;
- International markets;
- See also;
- Legal precedents;
- References.
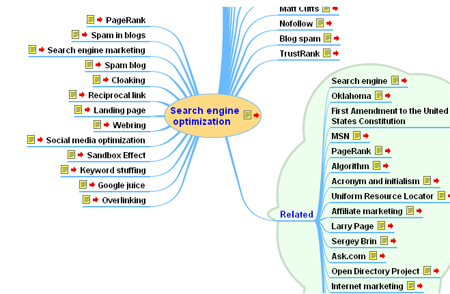
- VisWiki – This tool will help you in connecting with Wikipedia articles through interactive maps. It will help you view all the related topics and terms. To understand this tool better have a look at the image given below.
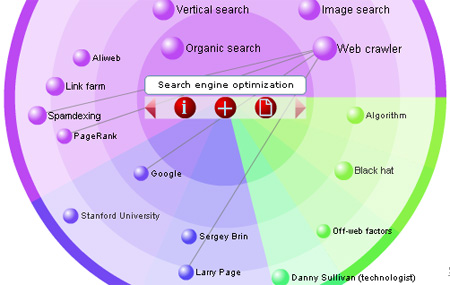
- EyePlorer – It visualizes knowledge graphs derived from Wikipedia content. This graph consists of eyespots, which denotes all the connected topics. All the eyespots are clustered together for better orientation.
- WikiRank– This tool is a bit new from the above mentioned tools as it visualizes page/term popularity on Wikipedia. Besides, determining the popularity of the topics the tool also allow you to compare popularity of many topics.
 tools for SEO Teams in 2026")


