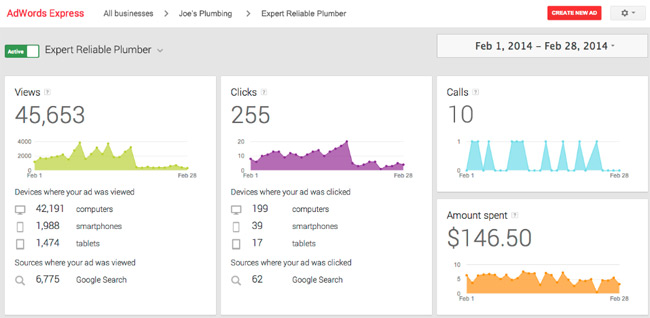
Now, even if you are not in the office, you can easily find out how many people have viewed your ad so far, just by using your mobile phone. Google announced in a post on Google+ that it has revamped the AdWords Express Dashboard to help marketers readily find information which is more important to them. Google's on-line advertising tool now shows data and charts which are not only more colorful and striking, but more productive for advertisers. The update has been made for mobile, desktop as well as tablet users.
Google has redesigned the dashboard with ad performance stats front and center. You can find your ad's performance just below the “Views” graph. The data shows how many times your ad was viewed on different platforms like computers, smart phones and tablets. Apart from this, the update also sows how many times your ad was clicked on these devices and the sources where your ad was clicked and viewed (like Google).
The recent change, allows marketers to see how users interact with their website after clicking on the ad. You can do this by connecting your AdWords Express and Google Analytics account. After linking the accounts you will see a new card on both the AdWords and Analytics account, showing how many new users visited your account as a result of the new ad, the average time spent on your website and the average number of pages viewed.
To link your Analytics and AdWords Express accounts, it is necessary that you use the same login email address for both the accounts. If you already have an Analytics account with the same login email address, Google will show the option to link your accounts on your AdWords Express dashboard. To sign up for an Analytics account, you can:
- Visit www.google.com/analytics/ and log in with the same login email address and password that you use for AdWords Express.
- Follow the steps during sign-up to generate your tracking code and to set up your web tracking.


