Google announced to involve real data from Chrome user experience report to come up with better PageSpeed insights, improved suggestions for developers, and enhanced optimization score.
With pagespeed tool, you can get an insight on how quick your web page loads using the real user data.
All pages may be classified into one of these three:
- Fast: The median value of the metric is in the fastest third of all page loads.
- Slow: The median value of the metric is in the slowest third of all page loads.
- Average: The median value of the metric is in the middle third of all page loads.
The new features can be summarized as follows:
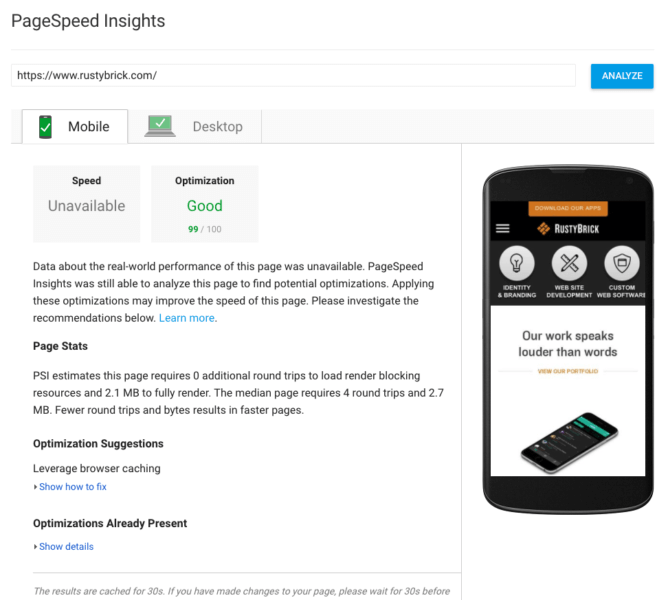
- The Speed score categorizes a page as being Fast, Average, or Slow.
- The Optimization score categorizes a page as being Good, Medium, or Low by estimating its performance headroom.
- The Page Load Distributions section presents how this page’s FCP and DCL events are distributed in the data set.
- The Page Stats section describes the round trips required to load the page’s render-blocking resources, the total bytes used by the page, and how it compares to the median number of round trips and bytes used in the dataset.
- Optimization Suggestions is a list of best practices that could be applied to this page.
Here is the pagespeed report screenshot for this site:

Here is the pagespeed insight screenshot: